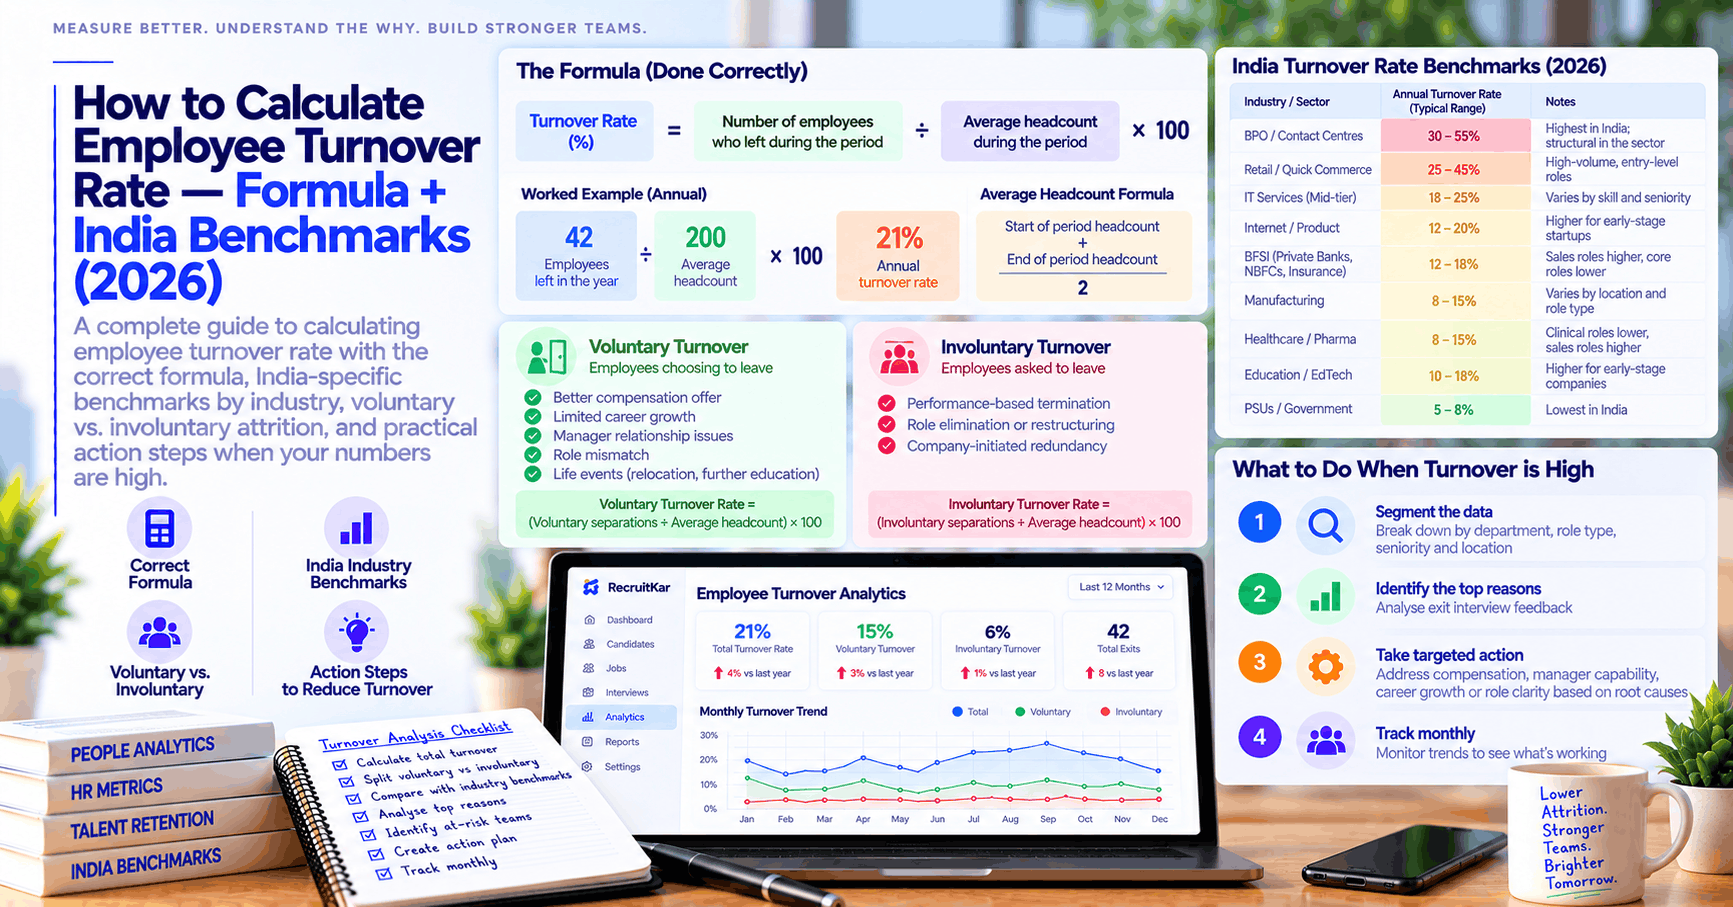
Employee turnover rate = (Number of employees who left during the period ÷ Average headcount during the period) × 100. For a company of 200 employees where 30 people left in the past year, with an average headcount of 210, that's (30 ÷ 210) × 100 = 14.3% annual turnover. Whether 14.3% is high, acceptable, or excellent depends entirely on your industry — BPO and retail in India routinely run 30–50% annually; IT services average 18–25%; manufacturing and PSUs average 5–8%. This post covers the correct formula, the India benchmarks by sector, how to separate voluntary from involuntary turnover, and what the number actually tells you about your hiring and retention problems. If high turnover is driving constant re-hiring, RecruitKar's AI-powered recruiting platform is built to compress the cost of each replacement hire while your retention work takes effect.
The formula, done correctly
The most common error in turnover calculations is using ending headcount rather than average headcount as the denominator. This distorts the rate if the company grew or shrank significantly during the measurement period.
The correct formula
Turnover rate (%) = (Separations during the period ÷ Average headcount during the period) × 100
Where:
- Separations = total number of employees who left during the period (resignations + terminations + retirements + any other exits)
- Average headcount = (headcount at start of period + headcount at end of period) ÷ 2
Monthly vs. annual calculation
Monthly turnover rate = (Separations in the month ÷ Average monthly headcount) × 100
Annual turnover rate = (Total separations in the year ÷ Average annual headcount) × 100
Alternatively, annual turnover can be calculated by summing 12 monthly rates — though this produces a slightly different number than a single annual calculation because of how headcount fluctuates across months. The single annual formula is more commonly used for benchmarking; the monthly sum is more useful for spotting seasonal patterns.
A worked example
Company profile:
- January 1 headcount: 185
- December 31 headcount: 215
- Total employees who left during the year: 42
Calculation:
- Average headcount: (185 + 215) ÷ 2 = 200
- Annual turnover rate: (42 ÷ 200) × 100 = 21%
Using ending headcount (215) instead of average headcount would give (42 ÷ 215) × 100 = 19.5% — a meaningful understatement, particularly for a growing company.
Voluntary vs. involuntary turnover — why the split matters
Reporting a single blended turnover number is less useful than separating voluntary departures (resignations) from involuntary departures (terminations for performance, role elimination, redundancies). The two have very different causes, very different costs, and very different solutions.
Voluntary turnover
Employees choosing to leave. The primary causes in India:
- Better compensation offer from a competitor
- Limited career growth or promotion velocity
- Manager relationship breakdown
- Role mismatch — the job turned out to be meaningfully different from what was described in the interview process
- Life event (relocation, caregiving, further education)
Voluntary turnover is the signal most worth acting on, because it reflects something within the company's control. A voluntary turnover rate that's rising quarter-over-quarter at a specific team, department, or location is a red flag worth investigating through exit interviews before it becomes a pattern.
Involuntary turnover
Employees asked to leave. Including:
- Performance-based termination
- Role elimination or restructuring
- Company-initiated redundancy
Some involuntary turnover is healthy — it reflects a company managing performance actively rather than accumulating underperformers. Involuntary turnover that rises sharply during a specific period often signals a hiring quality problem (people were hired who weren't suited for the role) or a management problem (performance standards weren't communicated clearly enough early enough).
The formula for each
Voluntary turnover rate = (Voluntary separations ÷ Average headcount) × 100
Involuntary turnover rate = (Involuntary separations ÷ Average headcount) × 100
The sum of the two equals total turnover rate.
India turnover benchmarks by industry (2026 estimates)
These are directional benchmarks based on available industry reporting and surveys. Treat them as reference ranges, not precise targets — your actual relevant benchmark is the rate for your specific role type, seniority level, and geography, not a national sector average.
- BPO / Contact Centres: 30–55% annually — highest in India; considered structural in the sector
- Retail / Quick Commerce: 40–60% annually — frontline roles; high seasonality effect
- IT Services (TCS, Infosys, Wipro tier): 18–25% annually — has moderated from pandemic-era peaks
- Product / Startup Tech: 20–35% annually — wide range depending on stage and funding environment
- Banking / BFSI: 15–25% annually — higher at frontline (branch, sales); lower at corporate
- FMCG (Sales teams): 20–35% annually — field sales roles see highest attrition
- Manufacturing: 8–15% annually — blue-collar varies by region; white-collar relatively stable
- Healthcare: 15–25% annually — nurses and paramedics see higher rates than clinical staff
- Education / EdTech: 20–40% annually — EdTech saw severe spikes post-2022 during sector correction
- PSU / Government: 2–5% annually — near-zero voluntary; mostly retirement-driven
Key caveat: These benchmarks reflect industry-wide averages that include all seniority levels and all geographies. Senior roles consistently show lower turnover than junior and frontline roles within the same company; metro cities tend to show higher voluntary turnover than Tier-2 cities for equivalent roles.
How to segment your turnover data for more useful signal
A single company-wide turnover rate is rarely actionable. Segmenting it reveals where to focus.
By department or team
A company with 14% overall turnover might have 8% in engineering and 35% in sales — an engineering manager who sees the blended number thinks "normal" while a retention crisis is building in sales. Department-level data reveals concentration.
By seniority level
Entry-level and junior roles almost always show higher turnover than senior roles in the same company. If senior turnover is rising (particularly at the manager and director level), this is a more alarming signal than equivalent junior turnover because of the institutional knowledge loss and the downstream effect on team stability.
By tenure band
Separating leavers by tenure — under 6 months, 6–12 months, 1–2 years, 2–5 years, 5+ years — reveals very different problems. High turnover in the under-6-months band typically reflects an onboarding or role-expectation mismatch (the hire discovered the role wasn't what was described). High turnover in the 1–2 year band often reflects a compensation plateau (the employee reached the top of their band and receives a better offer). High turnover in the 3–5 year band often reflects a promotion ceiling.
By manager
Manager-level turnover segmentation is uncomfortable but arguably the most useful analysis. Consistent patterns of high turnover under specific managers — particularly when those managers' teams show higher attrition than the department average — point to a management effectiveness problem that HR intervention can address. Without this data, the problem stays invisible.
By exit reason (from exit interviews)
Exit interview data is only as useful as the categories used to classify it. A generic "personal reasons" bucket that catches everything that doesn't fit elsewhere produces no actionable insight. Structured exit interview categories — compensation, growth, manager, role mismatch, work-life balance, external opportunity — produce segmentable data that shows whether turnover is primarily a compensation problem (fixable with compensation benchmarking), a growth problem (fixable with internal mobility programs), or a manager problem (fixable with management development or reassignment).
The real cost of high turnover — why the rate matters beyond the HR dashboard
Most HR teams report turnover rate without accompanying it with a cost estimate. This is a missed opportunity to build the business case for retention investment.
The components of turnover cost per departure:
- Recruiting cost: Cost-per-hire for the replacement (agency fee, job board spend, recruiter time, background verification)
- Productivity loss: The period between the departure and the replacement reaching full productivity — typically estimated as a multiple of the monthly salary, ranging from 0.5× salary for junior roles to 2–3× salary for senior or specialist roles
- Onboarding cost: Manager time, training, equipment, and administrative overhead for the new hire
- Knowledge loss: Harder to quantify but real — the institutional knowledge that departed with the leaver and that the replacement will take months to rebuild
For a company of 200 employees with 14% annual turnover (28 departures per year) at an average role replacement cost of ₹80,000 per hire (recruiting only), the direct recruiting cost of turnover is ₹22.4 lakhs per year. Adding productivity loss at a conservative 1 month of salary (at ₹50,000/month average), the total cost of turnover exceeds ₹36 lakhs annually — and this still excludes knowledge loss and management time.
This calculation, done with your actual numbers, is the most persuasive input to a budget conversation about retention investment.
What high turnover actually tells you about recruiting
Turnover rate is not purely a retention problem — it's a hiring signal. The most common hiring-related drivers of high turnover:
Role misrepresentation during hiring. If candidates are being sold a version of the role that doesn't match the reality they encounter — different scope, different management style, different team dynamics — the mismatch surfaces within the first 6 months. The fix is in the hiring process (more accurate role descriptions, structured interviews that reveal real job demands) before it's in the onboarding process.
Hiring the wrong fit for the culture or pace. Some candidates who are genuinely qualified technically are not suited to the company's current size, pace, or management approach. A structured hiring process that evaluates fit on specific, observable dimensions (not vague "culture fit") catches more of these mismatches before an offer goes out.
Compensation compression. When external hire packages have risen faster than internal salary bands, new hires may join at a premium to existing employees in equivalent roles — creating internal pay equity pressure that drives tenured employees to leave rather than stay. This is a compensation benchmarking problem, but it shows up in the turnover rate.
Hiring for the role as it is, not as it needs to evolve. Particularly in high-growth companies, a hire who was well-suited to the role at the time of hiring may be outgrown by the role within 18 months — particularly if the expectations for scope and complexity weren't communicated at hire. Proactive conversation about how the role might evolve, and whether the candidate is excited by (or concerned by) that trajectory, is a useful first-round interview signal that most processes skip.
A practical turnover tracking template
Track this monthly, minimum:
| Metric | This Month | Last Month | YTD | Same Period Last Year |
|---|---|---|---|---|
| Starting headcount | ||||
| New hires | ||||
| Voluntary separations | ||||
| Involuntary separations | ||||
| Ending headcount | ||||
| Average headcount | ||||
| Monthly turnover rate (%) | ||||
| YTD annualised turnover rate (%) |
Add department-level versions of this table once the monthly company-wide baseline is established. Rolling 3-month and 12-month averages smooth out one-off months (a planned restructuring, a seasonal peak) and reveal the underlying trend more clearly than single-month numbers.
Frequently asked questions
What is a "good" employee turnover rate in India? There is no universally good rate — only rates that are better or worse relative to industry, role type, and your company's own trajectory. A 20% annual turnover in an IT services company is industry-normal and doesn't require alarm. The same 20% at a 50-person startup losing 10 engineers per year is a significant operational problem. The more useful question is: is our turnover rate improving or worsening quarter-over-quarter, and is it higher than comparable companies competing for the same talent?
Should I include probationary exits in turnover rate? This is an internal policy decision, but the most common practice is to include them in the total turnover calculation (all separations count) while separately tracking "early attrition rate" — separations within the first 3–6 months — as a distinct metric. Early attrition that's substantially above the blended turnover rate is a specific signal of onboarding or hiring-fit problems that warrant investigation regardless of whether the employee was in probation.
What's the difference between attrition rate and turnover rate? In common Indian HR usage, these terms are often used interchangeably. In more precise usage, "attrition" refers specifically to headcount reduction through natural departures (typically voluntary exits) without replacement — the headcount shrinks. "Turnover" includes all departures, with the assumption that most roles will be backfilled. For most practical purposes in Indian HR reporting, they're calculated the same way and treated as equivalent.
How should we handle transfer exits — employees who move from one entity to another within the same group? Inter-entity transfers where the employee remains employed within the same corporate group are typically excluded from turnover calculations, since the employment relationship (at the group level) continues. Employees who formally resign from one entity and rejoin another (with a gap, or with a change in terms) are typically included. Define this clearly in your HR policy rather than deciding case-by-case.
How often should we report turnover rate to leadership? Monthly tracking for HR's own use, with a quarterly summary shared with leadership. Annual turnover rate shared with the board or investors if requested. For high-volume hiring operations or companies in sectors with structural high turnover (BPO, retail), monthly reporting to relevant business heads is appropriate since the numbers move meaningfully month-to-month. For stable, lower-volume organisations, quarterly reporting is usually sufficient.
Track what high turnover costs your recruiting budget — and compress the cost of each replacement hire. AI sourcing, automated screening, and multi-channel outreach reduce time-to-fill and cost-per-hire even during periods of elevated attrition. AI-powered recruiting platform built for Indian hiring teams.