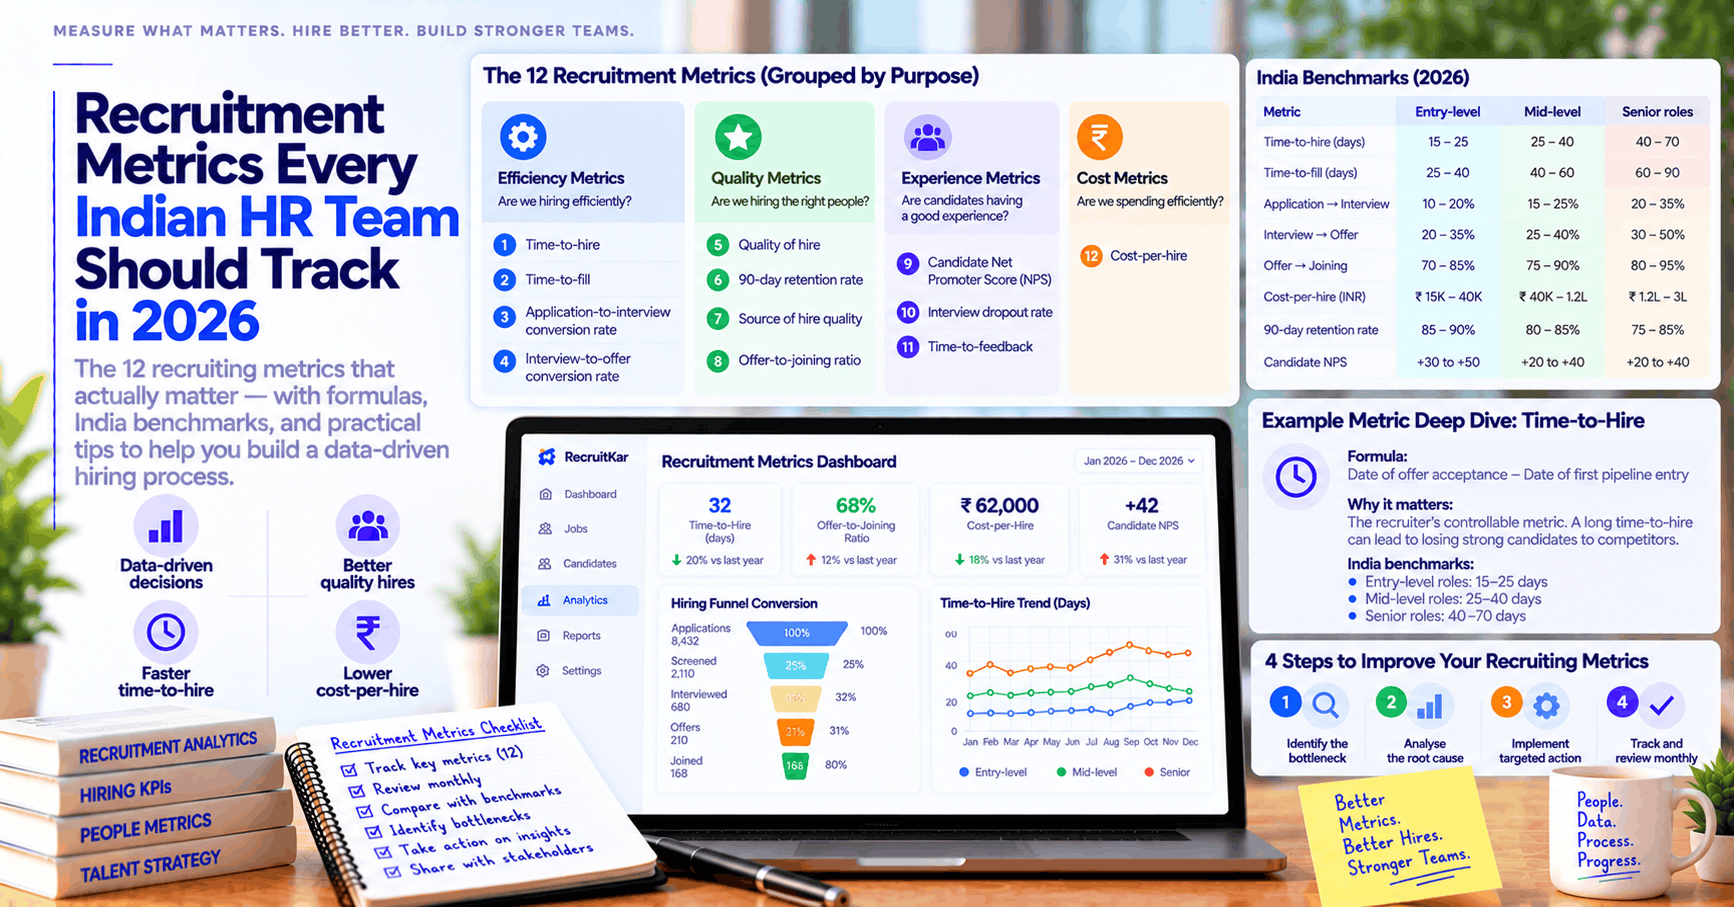
Most Indian HR teams track time-to-hire and headcount filled — and stop there. These two numbers tell you whether the machine is running, not whether it's running well. The 12 metrics below cover the full hiring funnel: sourcing efficiency, screening quality, candidate experience, offer conversion, and post-hire retention signal. Together they answer the question no single metric can: is your recruiting process producing good hires at a sustainable cost? RecruitKar's visual ATS pipeline tracks stage-by-stage conversion, source attribution, and offer status in real time — so the metrics below come from your pipeline data, not a quarterly manual spreadsheet exercise.
Why most Indian HR teams track the wrong metrics
The metrics most commonly reported in Indian HR dashboards — headcount hired, time-to-fill, and open positions — are operational outputs. They tell leadership that hiring happened, not whether it happened efficiently or well.
The more useful question set for a recruiting operation is:
Efficiency: Are we sourcing and screening candidates efficiently, or are we doing a lot of work that produces little output?
Quality: Are the candidates we're hiring actually performing well, or are we filling roles with people who leave or underperform within a year?
Experience: Are candidates having a good experience with our process, or are we damaging our employer brand every time we run a hiring drive?
Cost: Are we spending the right amount per hire, and do we know which channels and approaches produce the best ROI?
The 12 metrics below are organised to answer these four questions.
Efficiency metrics
1. Time-to-hire
Definition: Number of days from when a candidate enters your pipeline (first application or first sourcing contact) to when they accept a verbal offer.
Formula: Date of offer acceptance − Date of first pipeline entry
Why it matters: Time-to-hire is the recruiter's controllable metric. A long time-to-hire loses strong candidates to competitors who moved faster, particularly in India where active candidates typically run 3–5 simultaneous processes.
India benchmarks (approximate):
Entry-level roles: 15–25 days
Mid-level professional roles: 25–40 days
Senior / specialist roles: 40–70 days
What to track alongside it: Time-in-stage — which specific stage is consuming the most days. Time-to-hire that's high because interview scheduling takes 10 days is a different problem (and a different fix) than time-to-hire that's high because offer approval takes 10 days.
Don't confuse with: Time-to-fill, which measures from role opening to role filled and includes time before sourcing starts. Time-to-hire is within the recruiter's control; the pre-sourcing portion of time-to-fill often isn't.
2. Time-to-fill
Definition: Number of days from when a role is officially opened (requisition approved) to when an offer is accepted.
Formula: Date of offer acceptance − Date of requisition approval
Why it matters: Time-to-fill captures the full business impact of a vacancy — including the time a role sat unfilled before a recruiter even started working on it. Long pre-sourcing delays (waiting for a job description to be approved, waiting for a hiring manager to provide a brief) inflate time-to-fill without affecting time-to-hire.
Tracking both together reveals whether delays are in the sourcing/screening phase (recruiter problem) or the pre-sourcing phase (business process problem).
3. Application-to-interview conversion rate
Definition: Percentage of applicants who reach the interview stage.
Formula: (Candidates invited to interview ÷ Total applicants) × 100
Why it matters: This ratio reveals the quality of your sourcing and screening. A very low ratio (2–3%) typically means either the role is attracting many mismatched applicants (JD problem) or the screening criteria are too restrictive (eliminating candidates who should advance). A very high ratio (50%+) typically means screening is too permissive — interviewers are having to reject at the interview stage work that should have been filtered earlier.
Target range: 10–25% is typical for well-calibrated sourcing and screening. Adjust based on role type — volume roles have lower ratios; senior specialist roles may have higher ratios from a smaller, more targeted applicant pool.
4. Interview-to-offer conversion rate
Definition: Percentage of interviewed candidates who receive an offer.
Formula: (Offers extended ÷ Candidates interviewed) × 100
Why it matters: A low ratio suggests either sourcing is producing the wrong candidates (who look fine on paper but don't hold up in interviews) or the interview process is over-calibrated (setting standards higher than the role actually requires). Both are expensive — the former wastes interview time; the latter wastes sourcing time and loses candidates who could have been good hires.
Typical range: 15–35% for most professional roles. Significantly lower suggests a sourcing quality issue; significantly higher (above 50%) may suggest insufficient interview rigour.
Quality metrics
5. Offer acceptance rate
Definition: Percentage of extended offers that are accepted by the candidate.
Formula: (Offers accepted ÷ Offers extended) × 100
Why it matters: An offer acceptance rate below 70% is a significant signal — either compensation is not competitive, the offer is arriving too slowly (candidate has accepted elsewhere), or something in the interview process created doubts the candidate chose not to voice. Each of these has a different fix.
India-specific context: India's long notice periods mean that offer acceptance and actual joining are separated by 60–90 days, during which counter-offers are common. Track offer acceptance (candidate says yes) and offer-to-joining rate (candidate actually joins) as separate metrics.
6. Offer-to-joining rate
Definition: Percentage of accepted offers where the candidate actually joins on the agreed date.
Formula: (Candidates who joined ÷ Offers accepted) × 100
Why it matters: Unique to the Indian market, this metric captures counter-offer attrition and ghosting during the notice period. An offer-to-joining rate below 80% is worth investigating — it typically reflects insufficient engagement with candidates during the notice period or a compensation position that's too easily matched by the current employer.
This is the metric most Indian HR teams don't track — they count offer acceptances as "hires" and discover the gap only when the expected joiner doesn't show up on Day 1.
7. Early attrition rate (first 6 months)
Definition: Percentage of new hires who leave within 6 months of joining.
Formula: (Separations within 6 months of joining ÷ Total hires in the cohort) × 100
Why it matters: High early attrition is almost always a hiring or onboarding problem rather than a general retention problem. If people are leaving within 6 months, either the role wasn't accurately represented in the hiring process (role mismatch), the hiring assessment didn't predict fit well (evaluation problem), or the onboarding didn't set people up for success (onboarding problem). It is the single clearest lagging indicator of hiring quality.
Target: Below 10% for most professional roles. Above 20% in the first 6 months is a significant red flag requiring root cause investigation.
8. Hiring manager satisfaction score
Definition: Hiring managers' rating of the quality of candidates presented to them and the efficiency of the recruiting process.
Measurement: A simple 1–5 or NPS-style survey sent to hiring managers after each closed requisition, with 2–3 specific questions: "How satisfied were you with the quality of candidates shortlisted?" and "How smoothly did the recruiting process run?"
Why it matters: Recruiter-side metrics (time-to-hire, conversion rates) don't capture whether the people hired are actually performing well in the role. Hiring manager satisfaction is the closest leading indicator of quality-of-hire, collected at a point when the hiring manager has just evaluated the candidate pool and made a selection. Declining hiring manager scores over time are a signal worth investigating before it becomes a retention problem six months later.
Source and cost metrics
9. Source-of-hire
Definition: Which sourcing channel produced each hire — Naukri, LinkedIn, employee referral, direct application, agency, campus drive, etc.
Measurement: Tracked in the ATS by tagging the source when a candidate enters the pipeline. Requires consistent source tagging — a "Naukri" candidate imported via Chrome extension should be automatically tagged as Naukri, not left as "unknown."
Why it matters: Source-of-hire data answers: which channels are producing hires, not just candidates. A channel that generates 40% of applicants but 5% of hires is a volume generator with poor quality. A channel that generates 10% of applicants but 30% of hires is a quality source worth investing in. Without this data, sourcing budget decisions are guesswork.
Track source-of-hire quality, not just volume: Source-of-hire by volume tells you where candidates are coming from. Source-of-hire by conversion rate to offer tells you which sources are actually worth the investment. These two numbers are often surprising — referrals consistently produce higher conversion rates than job boards in most Indian companies, but this only becomes visible when the data is tracked properly.
10. Cost-per-hire
Definition: Total recruiting cost divided by total number of hires in the period.
Formula: (Total internal costs + Total external costs) ÷ Number of hires
Where internal costs = recruiter salaries (prorated), ATS/software costs, referral bonuses; external costs = agency fees, job board spend, assessment tools, background verification.
Why it matters: Without cost-per-hire, there's no way to evaluate whether recruiting investment is producing efficient returns or whether switching channels, tools, or approaches would produce equivalent hires at lower cost.
India context: Cost-per-hire varies enormously by role level and sourcing channel. A Naukri-sourced junior engineer hire might cost ₹25,000 in direct costs. An agency-sourced senior engineer at 10% of ₹20 LPA CTC costs ₹2,00,000+ for a single placement. Tracking cost-per-hire blended across all hires is a starting point; segmenting by role level and channel is where the actionable insight lives.
11. Sourcing channel ROI
Definition: Cost per hire from each sourcing channel, weighted by the quality of hires produced from that channel.
Formula (simplified): Cost of channel spend ÷ Number of hires sourced from that channel = Cost per hire per channel
For a more rigorous version: Multiply cost per hire per channel by a quality weight (based on early attrition rate or hiring manager satisfaction score for hires from that channel) to produce a quality-adjusted cost per hire.
Why it matters: Channel A at ₹50,000 cost-per-hire that produces hires with 5% early attrition is more valuable than Channel B at ₹30,000 cost-per-hire that produces hires with 30% early attrition. The cheapest channel isn't the best channel unless quality is equal.
12. Pipeline coverage ratio
Definition: Number of active candidates in your pipeline per open role at any given point.
Formula: Total active candidates in pipeline ÷ Number of open roles
Why it matters: A pipeline coverage ratio below 3:1 (three active candidates per open role) means you're likely to have a thin shortlist and may end up making compromised hiring decisions because you don't have enough options. A healthy pipeline has 5:1 or better before final evaluation rounds begin.
Use it as a leading indicator: If coverage ratio drops below threshold mid-process, it's a signal to restart or intensify sourcing before the interview stage stalls — not after a decision can't be made because there's only one candidate left standing.
Building your metrics dashboard
You don't need analytics software to start tracking these. A structured spreadsheet updated monthly — one row per hire, columns for each metric — produces most of the signal, particularly for teams hiring fewer than 50 people per quarter.
What you do need: consistent data capture at source. Source tagging, offer dates, joining dates, and early attrition data have to be recorded consistently before they can be reported on. The biggest gap in most Indian HR teams' metrics capability isn't the reporting layer — it's that the underlying data is inconsistently captured, which makes any dashboard built on top of it unreliable.
A visual ATS pipeline with stage-transition timestamps, source attribution, and offer status tracking provides the data foundation automatically — every stage change creates a timestamped record, every import from a job board is tagged by source, and offer and joining dates are logged against each candidate's record. The metrics above become reports pulled from that data, not a manual reconstruction exercise.
Frequently asked questions
Which single metric is most important for an Indian HR team to start tracking if they currently track nothing? Time-to-hire, segmented by stage. It's the metric with the most direct operational impact on candidate quality (slow processes lose strong candidates to competitors), it's straightforward to calculate, and stage-level data immediately shows where to focus improvement effort — whether it's screening delays, scheduling friction, or offer approval bottlenecks.
How do we track quality-of-hire without a formal performance management system? Use proxy metrics: early attrition rate (did the hire leave within 6 months?), hiring manager satisfaction survey (did the hiring manager feel the hire met expectations?), and 90-day check-in data (is the new hire on track against their initial objectives?). These aren't perfect quality-of-hire measures but are meaningfully better than tracking only cost and speed.
Should we track metrics per recruiter, or only at the team level? Both, with care. Team-level metrics show whether the function is performing well. Recruiter-level metrics show performance variation within the team — which is useful for coaching and development, but should be used carefully because recruiter metrics are heavily influenced by the roles they're assigned (a recruiter handling only senior specialist roles will have longer time-to-hire than one handling volume roles, for structural reasons). Context matters for individual interpretation.
How do we get hiring managers to complete satisfaction surveys consistently? Keep the survey to 2–3 questions maximum and send it immediately after an offer is accepted — not weeks later when the hiring manager has moved on. A 60-second survey sent at the moment of peak engagement (the hire is just closed) achieves far higher completion than a comprehensive survey sent three weeks post-joining. Automated survey triggers from pipeline stage changes eliminate the recruiter's dependence on memory to send it.
What's a reasonable target for offer acceptance rate in India? Above 80% is a reasonable target for most roles and industries. Rates below 70% consistently indicate a compensation competitiveness issue, a process experience issue, or offer delivery that's too slow. Rates between 70–80% are borderline and warrant investigation into which specific candidates declined and why. Note that offer acceptance rate and offer-to-joining rate are different metrics — track both, since a 90% acceptance rate combined with a 75% joining rate still means 32% of extended offers don't result in a hire.
Get your recruiting metrics from your pipeline data, not a manual exercise. RecruitKar's visual ATS pipeline tracks stage conversions, source attribution, offer status, and joining confirmation automatically — so your metrics report pulls from live pipeline data. Track what actually matters in hiring with a platform built for Indian recruiting operations.